
We’ve had a free Core Web Vitals report tool live on our website for years, but most people don’t realise it can be configured to email you an update each month with the previous month’s speed data. Setting it up takes less than five minutes. Here’s how to do it and how to read what it sends you.
Table of Contents
What the report covers
It’s a high level report that shows the Core Web Vitals speed data across your entire site, along with 12 months of site speed history. It’s an excellent way to keep track of your overall site speed and make sure everything is running OK. It’s also a fantastic report if you’re an agency or marketing manager and need to report on marketing activity on an ongoing basis.
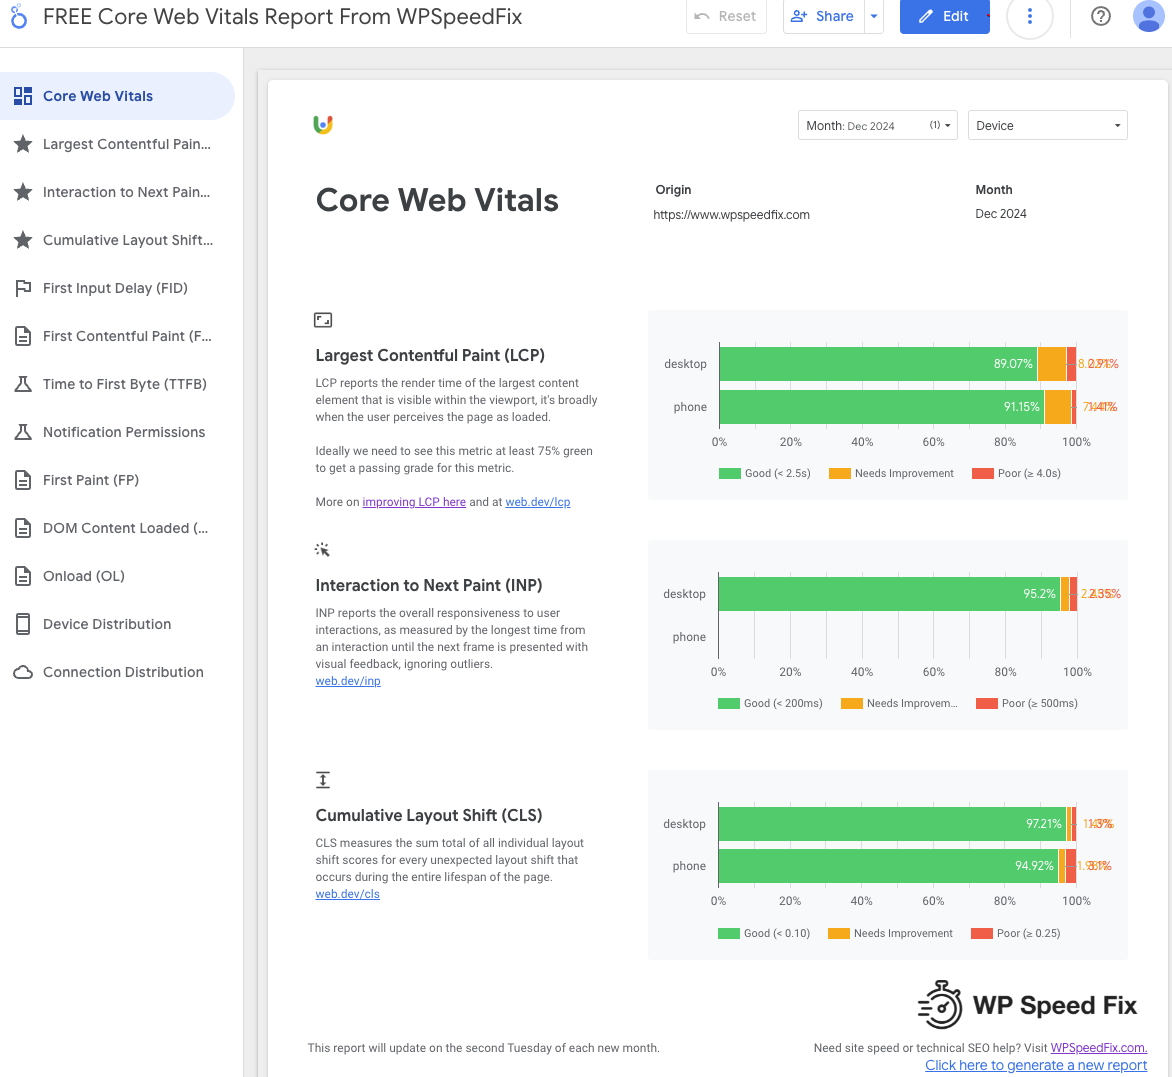
The report pulls from Google’s publicly available Chrome User Experience dataset, so you can also set it up to track competitor sites.
What you need
- A Google or free Gmail account, so you can copy the report into your own Google Looker Studio account. You can also edit the report to add your own brand and logo.
- A website with 50 or more visits a day. This is roughly the cutoff for Google to keep a Core Web Vitals dataset for your site. If your site is below that, there’s no data for the report to pull.
Step by step
- Generate the initial report for your site at wpspeedfix.com/cwv-report.html.
- Clone the report into your own Looker Studio account using your Google login.
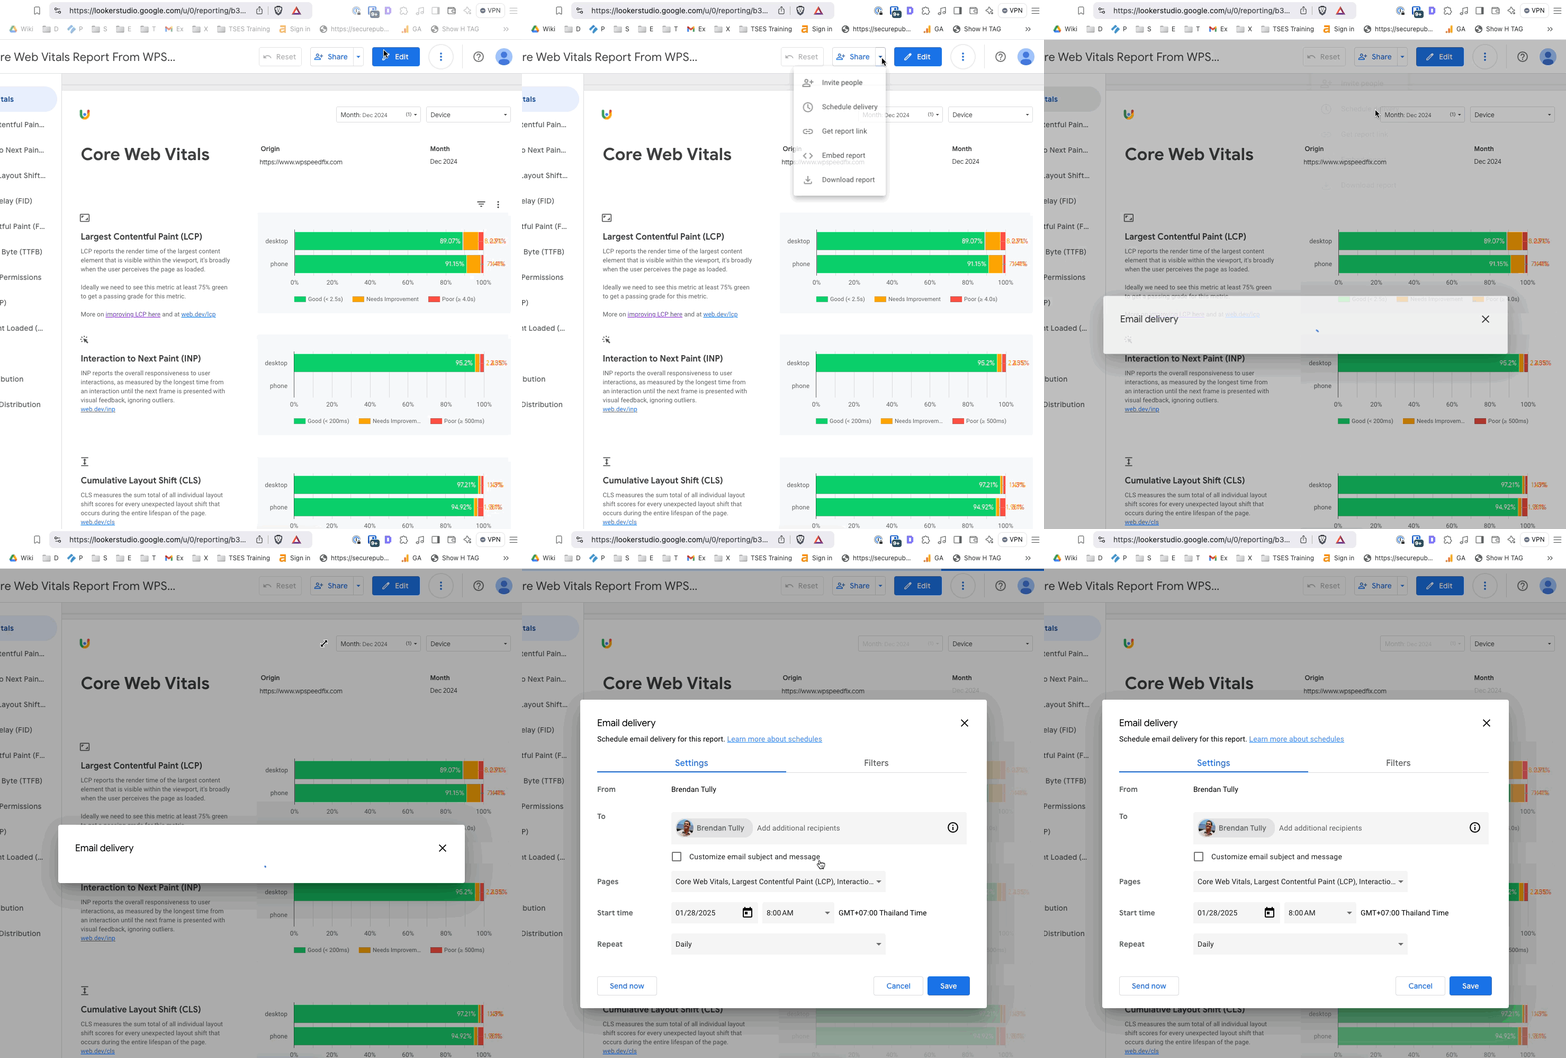
- In Looker Studio, schedule email delivery so the report is sent to you (or your client) on the first of each month with the previous month’s data.
This short video walks through cloning the report and configuring the monthly email.
How to read the report
If you want to see what the finished report looks like, here’s the live report for our own site. Broadly speaking, each metric needs to be at least 75% in the green zone for Google to consider your website to be passing Core Web Vitals and to be “fast”.
The tabs on the left show several other metrics that are also important.
Time to First Byte (TTFB)
TTFB is not a Core Web Vital, but it has a downstream impact on the metrics that are. It’s also critical that TTFB be good, say 60 to 70% or more green, if you’re running paid traffic. If you’re seeing a large portion of red in the TTFB section, say 40 to 50% red or 80% like the image below, a large portion of your users are staring at a blank screen for around two seconds while they wait for your site to load.
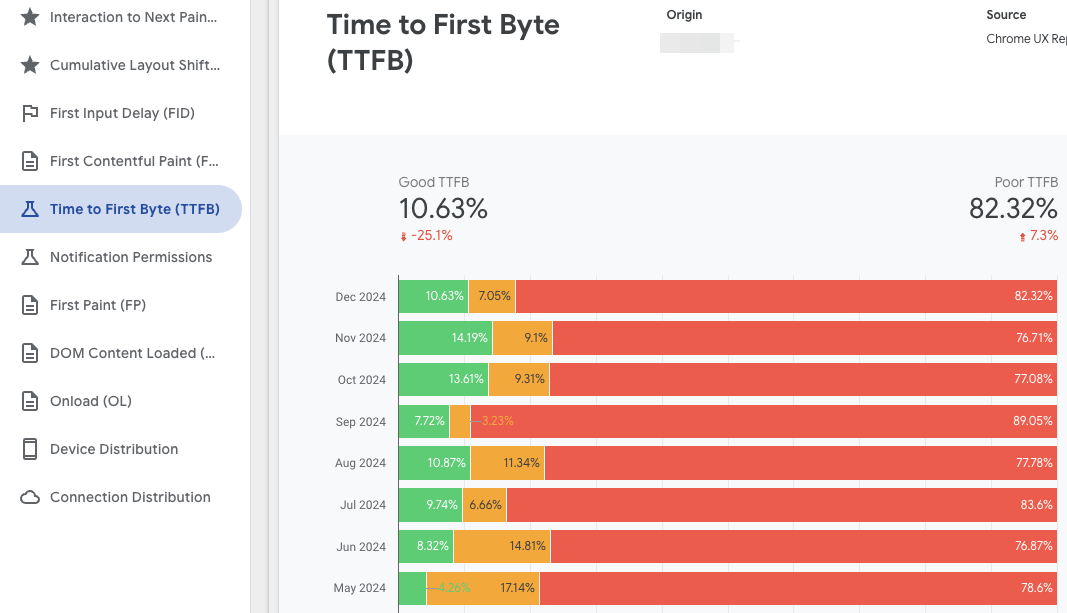
Above: when we see a large portion of red like this, visitors are waiting several seconds before anything starts happening.
Device distribution
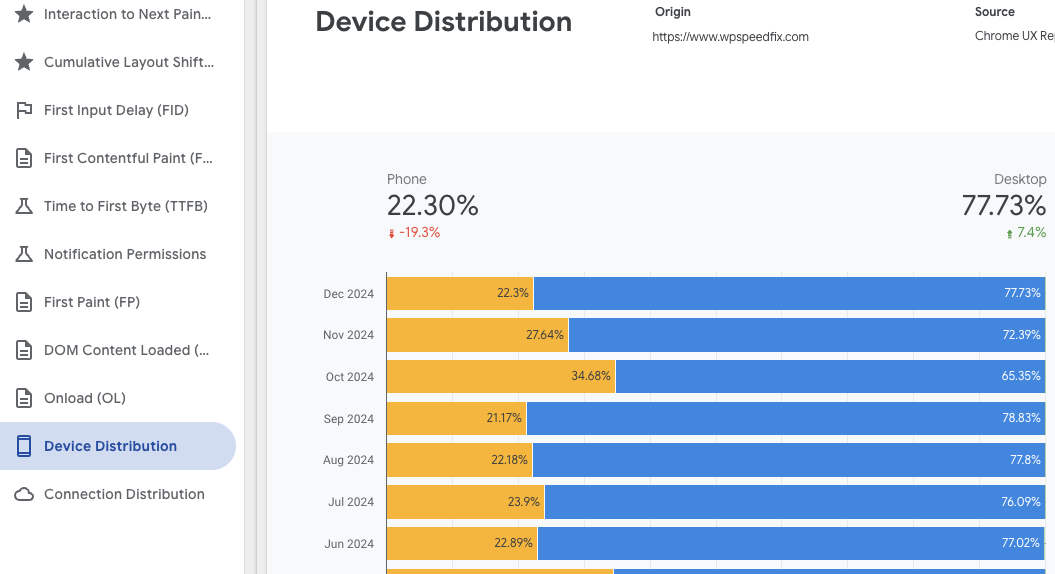
The Device Distribution tab tells you the split of mobile versus desktop users on your site. There’s a common misconception that mobile is always the most important device to focus on, but some sites get very little mobile traffic. On our own WP Speed Fix site, mobile is only around 23% of overall traffic, which means our desktop experience is a better place to put our focus and effort.
Once the monthly email is running you don’t need to remember to check anything. Open it when it lands, look for metrics that have slipped below 75% green, and check the TTFB tab before you spend money on paid traffic. Set it up at wpspeedfix.com/cwv-report.html.
This article was first sent to the WP Speed Fix email list. Subscribe here to get the next one in your inbox.
Video transcript: How To Setup FREE Monthly Site Speed & Core Web Vitals Report
0:00What the Free Monthly Speed Report Does
Hey, it's Brendan from WP Speed Fix. In this video we're going to talk through the process of setting up these free Core Web Vitals reports. These are fantastic reports. You can set them up so they will email a monthly report that tracks site speed, and it's completely free. I'm just going to walk you through the process of setting them up for your own site, or you can use them for client sites as well. It takes about 5 minutes to do and it's pretty straightforward.
The email report looks something like this. I've just done a test so you can see it. It's a nice pretty report. In the email itself it has screenshots of the report that look like this, and then it actually has the report attached as well in PDF format. It has lots of nice pretty colors. This one has our branding, of course, but you can edit that report to put your own branding in there, especially if you're an agency. So that's really good. It looks nice for clients, and it also helps you keep track of site speed across client sites, or your own sites, on an ongoing basis without having to do a whole bunch of work. So let's get into it. It takes about five minutes and it's all pretty straightforward. You'll need a Google account to do it, because we're going to use Google Data Studio.
1:09Generating the Report and the Traffic Requirement
First step: on our website we have this free menu, sorry, under Free Stuff, go to our free Core Web Vitals report. Now there is one caveat here. This report only works if you have enough traffic. The site needs to have something like 50 to 100 visits per day in order to have a big enough data set for Google's Core Web Vitals. If the site doesn't have enough traffic, the data set won't be big enough, there won't be enough data for this report, and so it won't work. The site needs to have a reasonable amount of traffic.
I'm just going to do it for our website as the example, wpspeedfix.com. I'll hit enter or click the button, and this takes 30 seconds to 60 seconds to build the report. So here we go. This is obviously for our website, and we'll do the most recent month by default. This data gets updated on the second Tuesday of each new month. We're at the end of January now, so that's why it's December's data. On February 15th or so, well, the second Tuesday in February, the data will be available for January 2025.
2:21Creating the Data Source and Copying the Report
I'm already logged into a Google account here, so what I want to do is go and make a copy. Now we need to create a new data source. Because the data source is linked to the Google account, we need to create a new one, so we need to go through this copy report process twice. I go here, click this drop down and go to Create Data Source, and you just want to type in Chrome. It's called Chrome UX Report. We do that, and you see these buttons here. You just want to pull this down a bit, because there'll be a popup that appears under here.
I'm just going to type in our web address again. It will work better if you just use the web address of your site by default. Type in your site or client website, and you want to hit this to allow that, that way you can modify the report. So if you want to change the branding, you can copy the report again and again. Just click Connect and it will give me a popup here somewhere. Yes, we want to allow, so just do that.
Now we have to do this twice. This step is creating the data source, and then we need to copy the report again. The data source will be in the dropdown, so we give that a minute. There we go. I want to add that to the report, and then we need to copy it again, so make a copy. Now in this drop down we should see Chrome UX Report. I've already done it once, so there are two. Just choose the top one there and copy report. This will take 30 seconds or something like that. It's going pretty fast today. Usually on a weekday it's a bit slower, so I suspect it's a weekend right now, and that's probably why it's a bit more snappy.
3:55Editing Branding and the Report Name
Okay, you see here it says copy of the free Core Web Vitals report from WP Speed Fix. Now you'll be able to edit it because it's your own copy. If you want to change the branding, and you're an agency, you can swap out the branding and so on here. You can see the pages down the left hand side. It's got all that branding all over it, so you want to edit it if you want to have your own branding. Now, setting up scheduled reports is very straightforward. This is your report now, so you might want to edit the name of it as well. Call it your website speed report, whatever you want to call it.
4:43Scheduling the Monthly Email
To set up email reports, you can just go to Share and Schedule Delivery. It opens up this modal where you can configure a monthly email. You just want to choose Custom, then every one month on whatever day it is. Since it's the second Tuesday of February, we probably just say on the 15th of each month, every one month on the 15th day, so we have the latest data. Then you give it your website speed report name, and the subject, put in whatever you like. It will come from the email address you logged in with. This is one of our shared accounts for the company, so it will come from this email address.
You can choose it there if you don't want to have all the pages inline on the report, and then just set the time you want it to run, and that's pretty much it. Set that up and save it. You can send a test. That's how I generated this, I just did a Send Now, so that's where that came from. You can see here it came from the WP Speed Fix team. If I hit reply on that, it should reply to the team at WP Speed Fix, yep. So that's pretty much it. Hit Save and then that schedule will run. This is the editor, in Looker Studio, Google Data Studio. If you just want to view it on the front end, you can just hit View.
6:18Changing the Website and What Happens Without Enough Traffic
What else? That's pretty much it. If you want to edit the data source or you want to edit the website, go to File and Report Settings and just change the URL here, and that will change the URL for the report. Like I said, if you don't have enough traffic, you won't have enough speed data for this report, so it will throw an error if the site isn't busy. Let me just try this other customer website. Okay, that one does have enough traffic, so you'll see the data there when we change it.
6:41Other Free Tools and Getting Help
So that's pretty much it, pretty straightforward. If you have any questions, post in the comments below. If you need help with site stuff or speed stuff, go to our website, wpspeedfix.com. There's a bunch of free stuff, so that was one of the free tools. There's also a free SEO audit tool there, again no opt-in required, just like that Core Web Vitals report. It takes 60 to 90 seconds to run. There's also a free site speed test tool, which is powered by AI, again no opt-in required. If you want help with site speed, just request a free audit there. Tell us what you need help with, SEO or site speed, give us some details, and one of the team will review the site and come back to you in a day or so. Like I said, if you get stuck or have any questions, just post in the comments below and we'll come back to you. Cheers.