
One of the biggest problems with site speed tracking is that Google’s Core Web Vitals data is based on a 28-day average, and everything Google gives you is either a site-wide average or data for a group of pages. That’s fine for a quarterly health check. It’s hopeless for actually diagnosing and fixing speed problems. Here’s why, and what we do about it.
Table of Contents
The problem with a 28-day average
We can’t wait 28 days to see if a change to a site has improved the speed. Any fix you make is blended into four weeks of old data, so it takes weeks before you can tell whether it worked.
The data Google provides isn’t precise either. Because it’s a site-wide or page-group average, it’s very difficult to troubleshoot page-specific issues, or issues that only affect a particular traffic type.
The flip side is just as bad. It can take weeks for a new problem to show up in Google Search Console, which means a site speed issue can go undetected while having a serious impact on conversions and SEO.
Per-session tracking
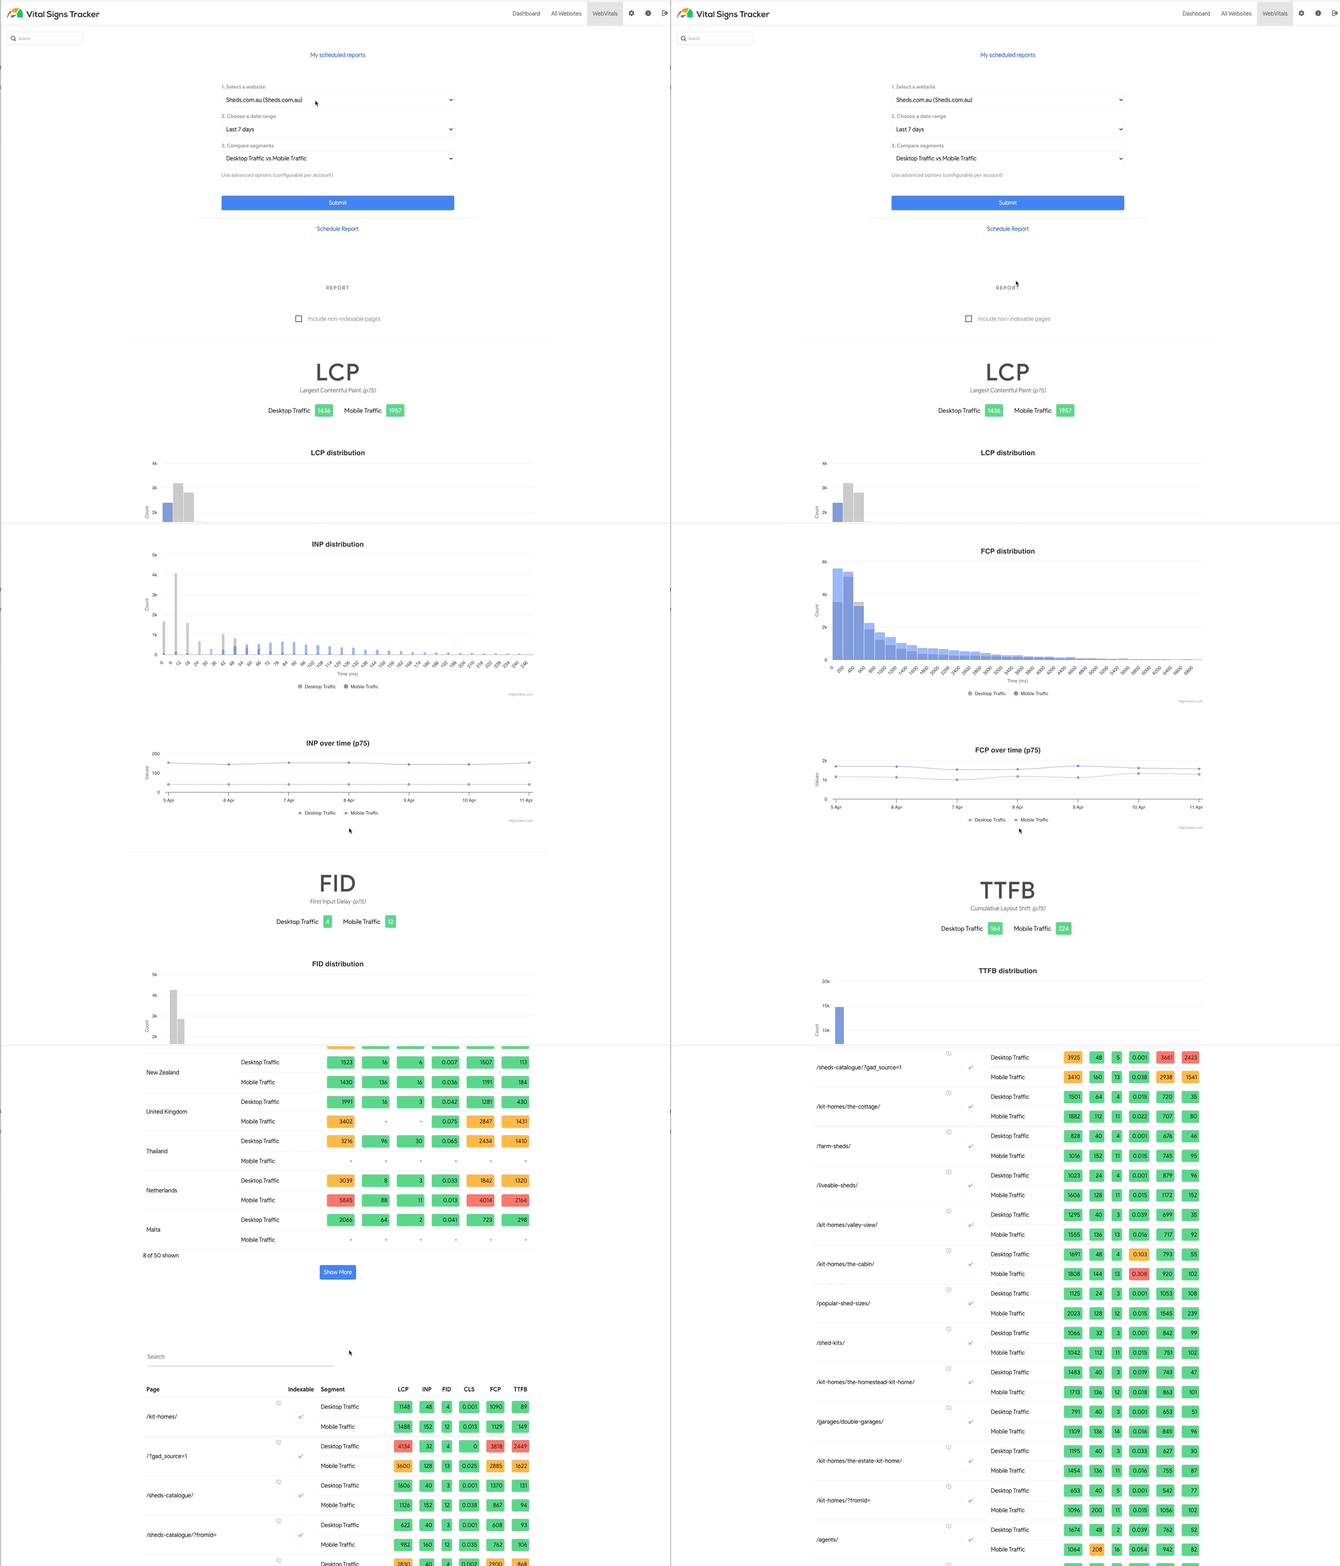
The fix is to capture the same Core Web Vitals data that Google uses, but at the browser session level, so you can see every page, every traffic type and every day rather than a rolled-up average.
To do this we built Vital Signs Tracker. It grabs the same Core Web Vitals speed data from the browser that Google is using and provides detailed reports on site speed, including weekly, fortnightly or monthly email reports, and visibility into page performance that other tools can’t give you. We refined it internally for nearly two years before making it available as a standalone product. There’s a short walkthrough video here.
What per-session data lets you see
Poor performance on particular traffic types
A common issue we see is slow Google Ads traffic caused by query strings being injected by marketing and click fraud prevention tools. We’ve seen sites spending seven and eight figures on Google Ads burning their budgets because site speed is horrible for traffic carrying those custom query strings. In a 28-day site-wide average this is invisible. Segmented by traffic type, it’s obvious, and identifying and fixing it has a direct impact on conversion rate and paid ad performance.
Email reporting that catches problems early
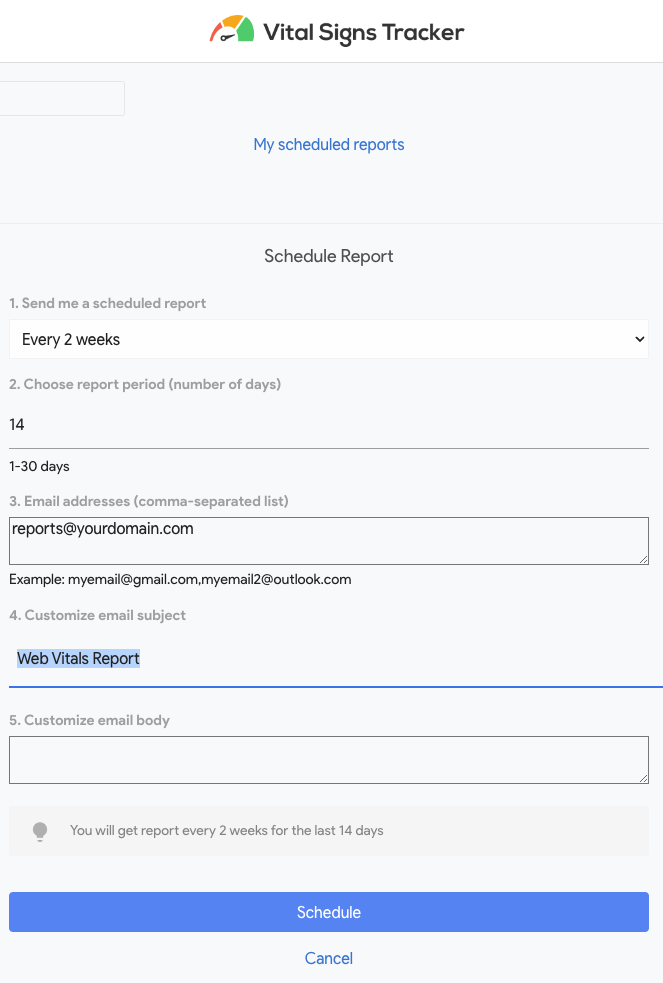
Weekly, fortnightly or monthly reports mean you can monitor site performance without manually running anything. This is particularly useful for agencies working on multiple sites, and it gives you a way to detect speed issues that would otherwise go unnoticed for weeks until they surface in Google Search Console.
Logged in versus logged out WordPress users
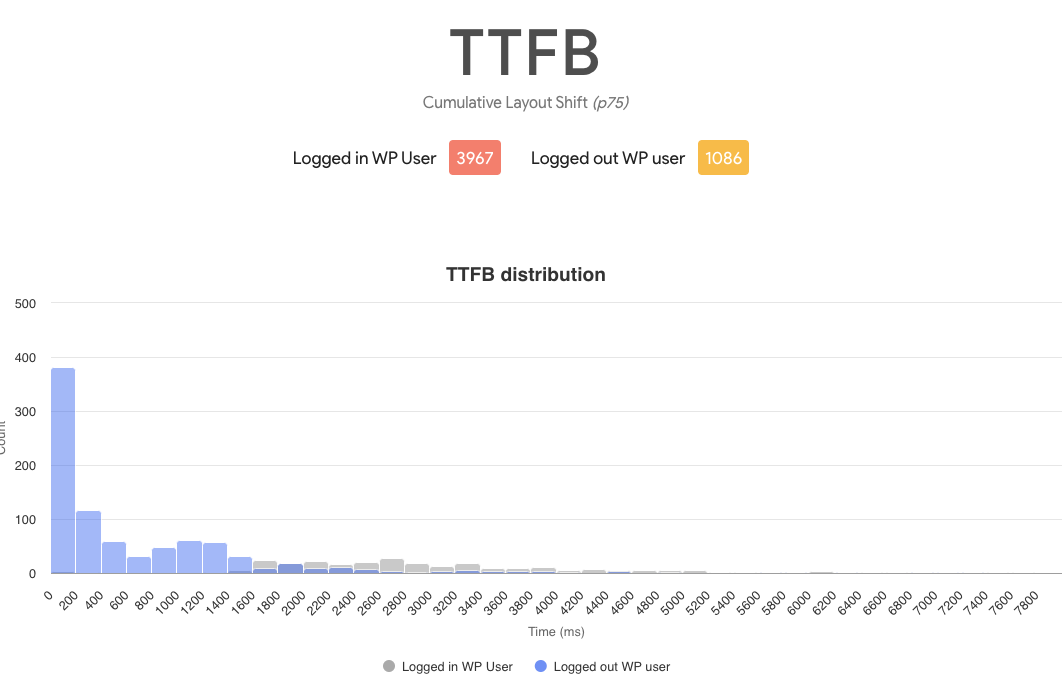
A common problem with WooCommerce, LMS and membership sites is that logged in sessions typically aren’t cached, so logged in users get a much slower experience than public visitors. Google’s data lumps them together. We devised a way to segment logged in and logged out WordPress users so you can see precisely how the site performs for each.
Non-indexable pages, including Cart and Checkout
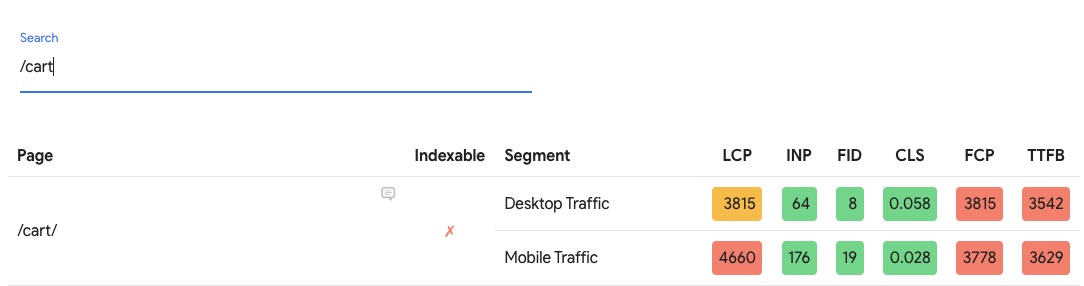
Core Web Vitals data is normally not tracked for pages with a robots noindex tag or pages that aren’t indexed in Google. That means the most commercially important pages on a WooCommerce store, Cart, Checkout and My Account, have no speed data at all in Google’s tools. Tracking every page and capturing the robots tag means you can see the performance of all of them.
Tricky INP issues
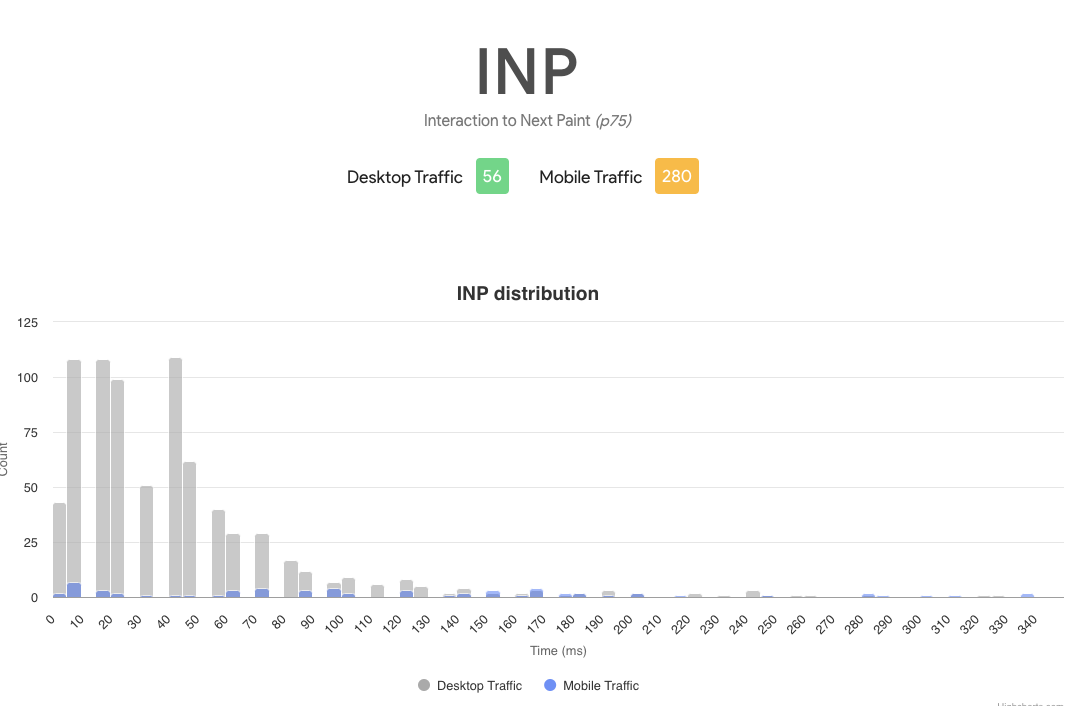
INP (Interaction to Next Paint) is Google’s newer Core Web Vital metric. Page-level visibility into INP means issues can be pinpointed to the page and template causing them and resolved, rather than guessed at from a site-wide score. We’ve written more on this in fixing INP issues.
CLS issues
CLS (Cumulative Layout Shift) problems are hard to detect because they often happen on specific pages or page templates, and it’s not immediately obvious which pages are affected. Per-page data shows you exactly where the shifting is happening.
Custom segments
The tracker is powered by a custom version of Matomo Analytics, which allows up to 100 custom segments for tracking site performance. You can track by location, device type, traffic type and much more, and it supports multiple sites so agencies can cover client sites too.

Google’s 28-day averages are still worth watching because they’re what Google ranks you on. For finding and fixing the actual causes of slow pages, you need session-level data broken down by page, traffic type and user state, and you need it the same week the problem starts, not a month later.
This article was first sent to the WP Speed Fix email list. Subscribe here to get the next one in your inbox.